SaaS Valuations Update
This is an update on the data in my previous post on Software-as-a-Service (SaaS)Valuations. For full context, read the original post here:
Keeping it SaaS-y: Valuations for SaaS Companies
Many of you have reached out to me asking for the source data in this post. Since it’s based on an internal analysis we did at Bain Capital Ventures, I thought I’d share the updated version of the data.
SaaS Valuations Grouped by Growth Rate & Margin (March 2013)
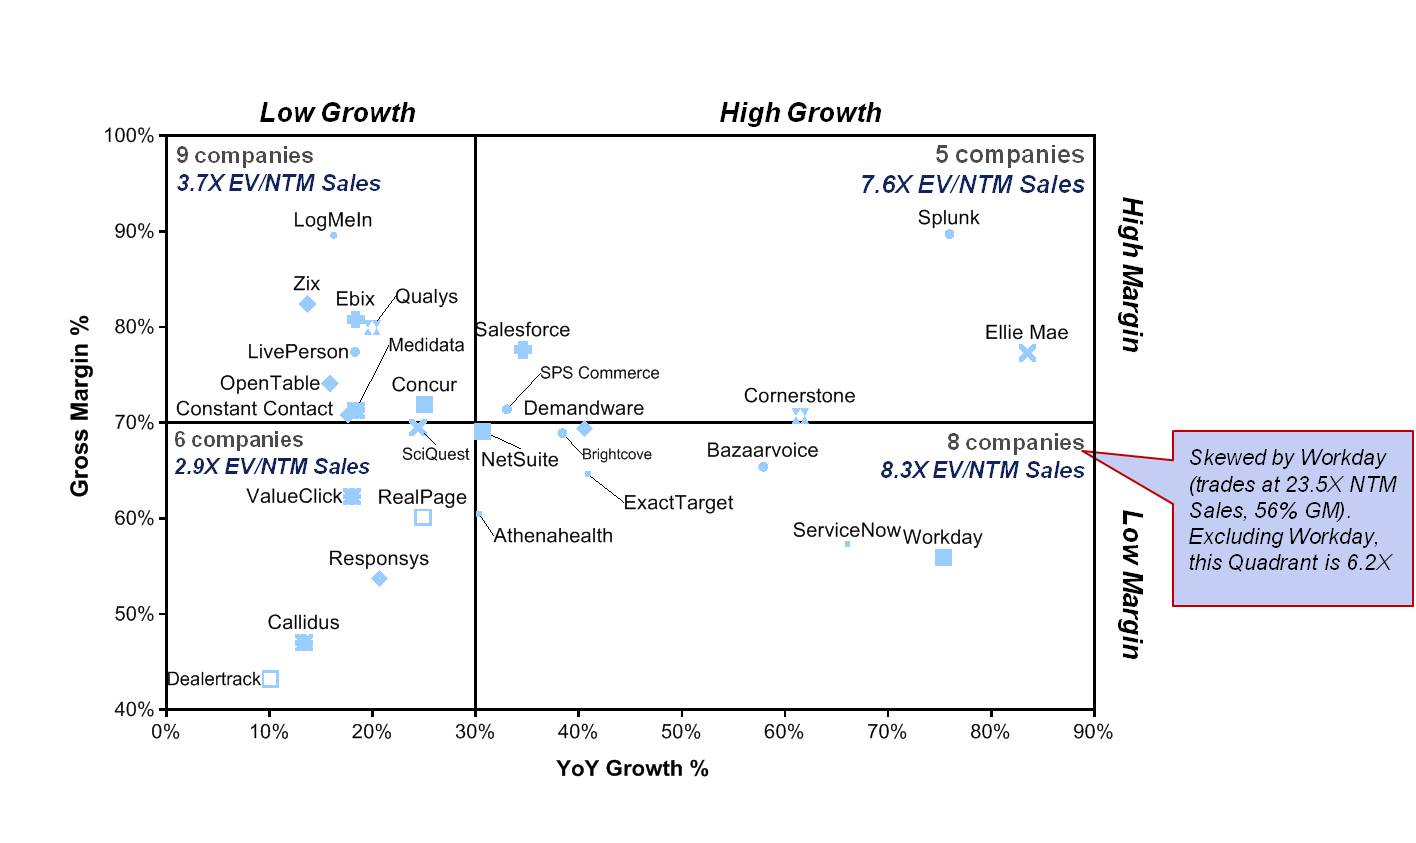 In short, looking across all public SaaS Co’s, high growth (>30% YoY), high gross margin (>70%) companies trade at 7.6X Enterprise Value / Next Twelve Months (EV/NTM) Sales, vs. industry wide average of 5.5X.
And growth rate matters more than gross margin. The top-left quadrant (low growth, high gross margin) trades at 3.7X. The bottom right quadrant (high growth, low gross margin) trades at 6.2X, if you strip out Workday.
Posted on April 16, 2013, in Uncategorized and tagged SaaS Valuations, Software Fundraising, Software-as-a-Service. Bookmark the permalink. Leave a comment.

Leave a comment
Comments 0